InUX CollectivebyWeronika Gawarska-TywonekCut to the chase and only show important data#34: Key MessageJun 7, 2023Jun 7, 2023
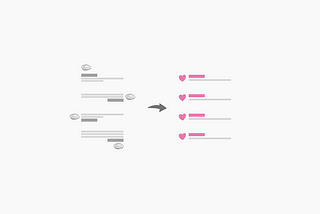
InUX CollectivebyWeronika Gawarska-TywonekIcon charts: examining the hidden flaws and seeking better solutions#33: Icon chart alternativeMay 25, 2023May 25, 2023
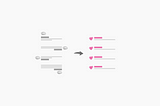
InUX CollectivebyWeronika Gawarska-TywonekFormat, align, repeat: three steps to master chart labels#32: Label formattingMay 18, 2023May 18, 2023
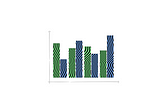
InUX CollectivebyWeronika Gawarska-TywonekSmall bites, big results: how analyzing info in chunks can change everything#31 Small multiplesMay 11, 2023May 11, 2023
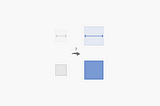
InUX CollectivebyWeronika Gawarska-TywonekA good reason to say no to grouped column (and bar) charts#30: Panel barsMay 3, 2023May 3, 2023
InUX CollectivebyWeronika Gawarska-TywonekShowing, not telling: How the chart says more than a hundred words?#29: Power of visualizationApr 26, 20231Apr 26, 20231
InUX CollectivebyWeronika Gawarska-TywonekHow to optimally organize information on the chart?#28: Limiting the categories for clarityApr 19, 2023Apr 19, 2023
InUX CollectivebyWeronika Gawarska-TywonekWhy does mixing apples and oranges work for juice but not for a chart?#27: Providing the right aggregation levelApr 15, 2023Apr 15, 2023
InUX CollectivebyWeronika Gawarska-TywonekFocusing on the polarization: Designing effective charts for the Likert scale#26: 100% Stacked Bars or Diverging Stacked BarsMay 14, 2023May 14, 2023
InUX CollectivebyWeronika Gawarska-TywonekFrom bland to bold: four steps to a memorable chart#25: Transition from a line chart to an area chartMar 31, 20232Mar 31, 20232
InUX CollectivebyWeronika Gawarska-TywonekGrey is the new black: a study on progress bars#24: Turning bar charts into progress barsMar 24, 20231Mar 24, 20231
InUX CollectivebyWeronika Gawarska-TywonekData visualization: formatting tips for transforming your dot plotsFrom dot plot to dumbbell chart.Mar 16, 20231Mar 16, 20231
InUX CollectivebyWeronika Gawarska-TywonekBalancing complexity and simplicity in chart design#22: The one with the simplified line chartMar 8, 20232Mar 8, 20232
InUX CollectivebyWeronika Gawarska-TywonekDealing with uncertainty: where to put ‘don’t know’ answer#21: The Redesign of the Survey DataMar 2, 2023Mar 2, 2023
InAnalytics VidhyabyWeronika Gawarska-TywonekScatter plot: is not so scary after all#20: The one about the Scatter plotOct 25, 20211Oct 25, 20211
Weronika Gawarska-TywonekStorytelling — a simple trick to grab the user attentionNo matter how nice your data viz is, without the story, it tells nothing.Oct 4, 20211Oct 4, 20211
InCounter ArtsbyWeronika Gawarska-TywonekSimplicity is a data visualization best friendIncremental Improvements #18: Chart junkSep 21, 20211Sep 21, 20211
InCounter ArtsbyWeronika Gawarska-TywonekWhat happens when finding the right color for data viz fails?Incremental Improvements #17: Intuitive color-codingSep 13, 2021Sep 13, 2021
InDataDrivenInvestorbyWeronika Gawarska-TywonekWhen you obscure the data you lose a chance to deliver your insightIncremental Improvements #16: Stacked column chart alternativeSep 7, 20211Sep 7, 20211
InDataDrivenInvestorbyWeronika Gawarska-TywonekPoor color choices that discriminate the part of your audienceIncremental Improvements #15: Color-blind-friendly paletteAug 9, 2021Aug 9, 2021